


Scroll to learn more


SOLUTIONS DEVELOPMENT

INNOVATION THROUGH COLLABORATION


Great automation solutions come from two sources:
Experience and Data.
We have both,
and we start by listening to you.
THE CHALLENGE


Our focus is on improving your time-to-value,
addressing factors unique to your business,
and delivering a solution tailored for your success.
THE APPROACH

Solutions development starts with understanding business goals and how they relate to your operational objectives and the operations, material handling automation, software and data science that ties them together.
BUSINESS METRICS
Results focused on ensuring our solutions are contributing to your business success.
ASSOCIATES
> Turnover Rate
> Retention Rate
> Absenteeism Rate
> Employee Satisfaction Rate
CUSTOMERS
> Time Order to Delivery (O2D)
> Returning Customer Rate
> Average Order Value
> Avg Profit Margin per Order
FINANCIALS
> Gross Margin
> Net Profit Margin
> Quick Ratio
> Sell Through Rate
> Revenue per Employee Ratio
> Inventory Shrinkage
MARKET
> Year over Year Sales Growth
> Same Store Sales Growth
> New Customer Sales Growth

OPERATIONAL METRICS
Results focused on ensuring our solutions positively impact your operations.
ASSOCIATES
> Cost per Turnover
> Reportable Accident Rate
> Turnover Rate
> Star Retention Rate
CUSTOMERS
> Perfect Order Index
> % Orders On-Time
> Order Accuracy
> Return Rate (Items)
FINANCIALS
> Units per Labor Hour
> Cost per Piece
> Inventory Accuracy
> Inventory Carrying Costs
MARKET
> Net Landed Cost
> Orders per Hour
> Lines per Hour
> Order Cycle Time
> Dock to Stock Time

FINDING INFORMATION IN YOUR DATA
Our team takes a business data approach to understand your operation.
We use data science and decades of operational know-how to uncover important things about your business and the operational insights for design and planning.

Order Volumes and Inventory Movement

Order Lines
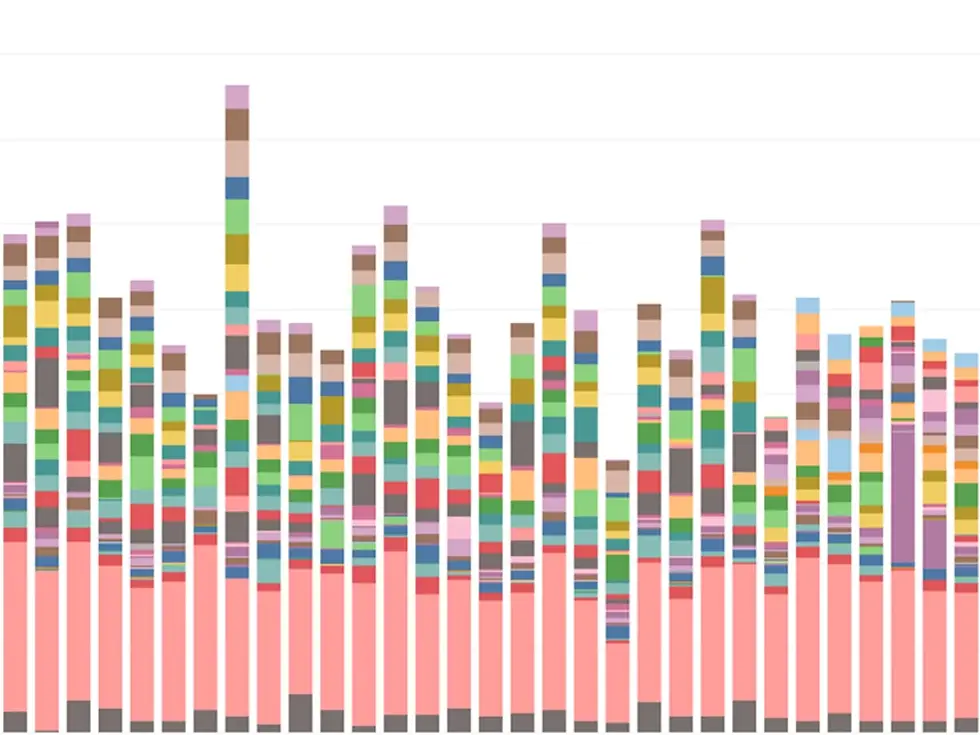
Shipping Volumes by Service Levels

SKU Commonality

SKU Velocity Over Time

Order Type Volume Variance
And More...
THE SOLUTIONING PROCESS

The approach continues with a collaborative process combining pillars of excellence, defining what matters and aligning on a solution that fits you.
May look complicated, but it is not. Our process is:
- Non-traditional
- Nimble
- Inclusive
- Shared Insights
- Cross-Functional
- Cycles of Learning
- Time-to-Value Focused

THE SOLUTIONS FIT


Having great technology is, well, great. Having a team with know-how for combining technology and operations to match your specific business goals is the key to delivering a result!
During the process, we evaluate technologies and how well they will fit your operational and business goals, down selecting to the approach that best fits you.

THE SOLUTIONS DELIVERY
After we have aligned and designed the solution, there is more work to be done to deliver excellence!
Our process includes a “wrap-around experience” that includes startup and operational coaching to help your team thrive, and downstream operational assessments to identify continuous improvements.


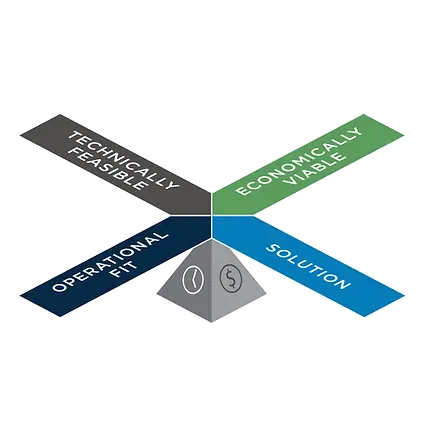
The result is all about time-to-value and delivering the solution that has the right balance of technology, ROI, and operational fit.
Getting to the result is all about data science-led innovation through collaboration.
